A Practical Observability Architecture for Go apps
10 min read
Introduction
My current homelab setup consists of a single VM running a k3s cluster. So far, my primary focus has been on getting the fundamentals right: securely exposing applications to the internet, safely accessing the cluster, managing self-hosted databases with automated backups, handling secrets, and implementing GitOps with FluxCD. When it came to observability, I initially aimed for an easy, out-of-the-box experience. I started with Grafana Cloud, drawn by its generous free tier and excellent Helm charts that provide Kubernetes observability with minimal effort. Over time, however, I decided to move away from the managed approach in order to deepen my understanding and build the observability stack myself. My goal wasn’t limited to metrics—I wanted to implement all three core pillars of observability: metrics, traces, and logs. Until now, I had been monitoring only the Kubernetes cluster itself. I also wanted to learn how to properly observe my Golang applications: producing structured logs, instrumenting services with OpenTelemetry, and exporting metrics using the Prometheus client.
Overview
I will split this blog post into two parts. In the first part, I’ll describe the overall architecture of my self-managed observability stack and explain why I chose each technology. In the second part, I’ll walk through how to fully observe a sample Golang application.
Observability Architecture
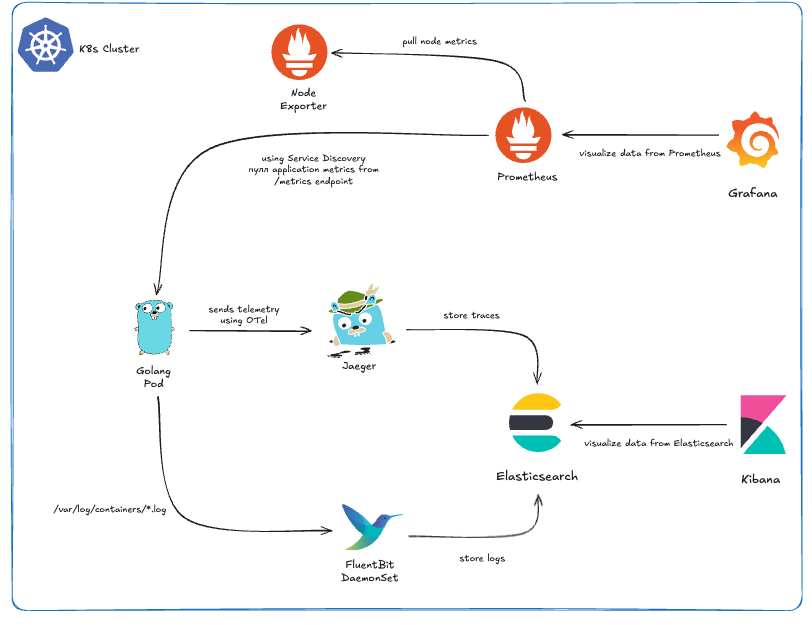
- Metrics: I decided to pick Grafana and Prometheus because they are the gold standard for metrics collection and visualization in the Kubernetes ecosystem. To make deployment easier, I used the kube-prometheus-stack Helm chart, which sets up the Prometheus Operator, Prometheus, and Grafana. Since my VM has limited resources, I had to disable most of the exporters and Alertmanager to keep resource usage low. What I kept was essentially Node Exporter for system metrics and the ability to use service discovery to collect metrics from my own applications. One of the coolest things about the kube-prometheus-stack is that Prometheus comes pre-configured as a datasource for Grafana. Also it’s incredibly easy to find an existing dashboard and import it into this setup. The flow is simple: you find a dashboard you like, go to Grafana, import it (either via its dashboard ID or JSON), select Prometheus as the datasource, and you have a working dashboard instantly. Even better, Grafana allows you to export the dashboard JSON after it’s imported and configured with the right datasource. You can then put this JSON into a ConfigMap and label it with grafana_dashboard: "1" and you are done!
--- apiVersion: v1 kind: ConfigMap metadata: labels: grafana_dashboard: "1" name: dashboard-go-processes namespace: monitoring data: dashboard-go-processes.json: |- { "description": "Process status published by Go Prometheus client library, e.g. memory used, fds open, GC details", # ... } - Traces & Logs: The approach I took for traces and logs is a bit different from the usual industry defaults, but it was intentional. For logs, I chose the EFK stack over the more common ELK setup with Filebeat. For tracing, I went with Jaeger using the same Elasticsearch as the storage. Why Jaeger? Recently, I became a contributor to the project, so running it myself gives me a hands-on opportunity to understand its internals, experiment with features, and explore its full capabilities. You might wonder: if I’m using Jaeger with Elasticsearch, why not just go with the ELK stack for everything, and why Fluent Bit? The reasoning comes down to flexibility and future-proofing. Jaeger supports multiple storage backends and is actively working on native ClickHouse support. ClickHouse is gaining a lot of traction in the observability space for its high performance and efficiency, and I didn’t want to be locked into Elasticsearch alone. Fluent Bit fits perfectly into this setup. It can send logs to Elasticsearch now, but it also supports ClickHouse, giving me an easy path to migrate if I want better performance or scalability later. Interestingly, this kind of setup isn’t uncommon—some big industry players like OpenAI and Cloudflare use a similar architecture for their logging solutions.
Observe a Golang Application
Let's start with a basic Go application. This is a common setup: a simple HTTP server using the Chi framework for routing and sqlc for database access. The application exposes a single endpoint: POST /users, which inserts a new user into a PostgreSQL database.
package main

import (
	"context"
	"database/sql"
	"encoding/json"
	"log"
	"net/http"

	"github.com/go-chi/chi/v5"
	"github.com/godruoyi/go-snowflake"
	"github.com/iypetrov/o11y/database"
	_ "github.com/lib/pq"
	"github.com/pressly/goose/v3"
)

// Ignore the fact that there are no json tags
type User struct {
	Name string
	Age  int
}

func main() {
	ctx := context.Background()

	// Connect to database
	db, err := sql.Open("postgres", "postgres://user:pass@localhost:5432/o11y?sslmode=disable")
	if err != nil {
		log.Fatalf("failed to connect to the database: %s", err)
	}
	defer db.Close()

	// Apply migrations
	if err := goose.SetDialect("postgres"); err != nil {
		log.Fatalf("failed to set dialect: %s", err)
	}
	if err := goose.Up(db, "sql/migrations"); err != nil {
		log.Fatalf("failed to apply migrations: %s", err)
	}

	// Router setup
	r := chi.NewRouter()

	r.Post("/user", func(w http.ResponseWriter, r *http.Request) {
		queries := database.New(db)

		var user User
		if err := json.NewDecoder(r.Body).Decode(&user); err != nil {
			http.Error(w, err.Error(), http.StatusBadRequest)
			return
		}

		result, err := queries.CreateUser(ctx, database.CreateUserParams{
			ID:   int64(snowflake.ID()),
			Name: user.Name,
			Age:  int64(user.Age),
		})
		if err != nil {
			http.Error(w, err.Error(), http.StatusInternalServerError)
			return
		}

		w.Header().Set("Content-Type", "application/json")
		w.WriteHeader(http.StatusCreated)
		if err := json.NewEncoder(w).Encode(result); err != nil {
			log.Printf("failed to encode response: %s", err)
		}
	})

 	log.Println("Server running on :3000")
	http.ListenAndServe(":3000", r)
}
Now we have to make a few changes to this application to make it production-ready and fully observable.
Structured Logging
First, let's clarify what structured logging means and why it's important. Structured logging involves formatting log messages in a consistent, machine-readable format, such as JSON. This approach allows for easier parsing, searching, and analysis of logs, especially when dealing with large volumes of log data. Popular library in the Go ecosystem is zerolog, which provides a simple and efficient way to produce structured logs. Now let's modify our existing application to use zerolog for structured logging.
package main

import (
    // ...
  	"github.com/rs/zerolog"

)

func main() {
	ctx := context.Background()

    // Structured logging setup
	log := zerolog.New(os.Stdout).With().Timestamp().Logger()
	zerolog.SetGlobalLevel(zerolog.DebugLevel)
	zerolog.TimeFieldFormat = time.RFC3339
	zerolog.TimestampFunc = func() time.Time {
		return time.Now().UTC()
	}

    // ...
	if err != nil {
        log.Err(err).Msg("failed to connect to database")
	}

	// ...
	if err := goose.SetDialect("postgres"); err != nil {
        log.Err(err).Msg("failed to set dialect")
	}
	if err := goose.Up(db, "sql/migrations"); err != nil {
        log.Err(err).Msg("failed to apply migrations")
	}

	// Router setup
	r := chi.NewRouter()

	r.Post("/user", func(w http.ResponseWriter, r *http.Request) {
        // ...
		if err := json.NewEncoder(w).Encode(result); err != nil {
			log.Printf("failed to encode response: %s", err)
		}
	})

    log.Info().Msg("starting server on :3000")

	http.ListenAndServe(":3000", r)
}

// Before: 2026/01/22 23:34:01 Server running on :3000
// After: {"level":"info","time":"2026-01-22T22:22:42Z","message":"starting server on :3000"}
Prometheus Metrics
The idea is to create an HTTP endpoint (GET /metrics) that exposes metrics in a format Prometheus can scrape. In Go, there are several ways to do this, but the most popular approach is to use the official Prometheus client for Go. In this example, we’ll do two things: first, create a /metrics endpoint that exposes the default Go runtime metrics; second, create a custom metric that counts the number of users created. For simplicity, we’ll expose the metrics on the same port as the main application. However, in a real-world setup, this is not recommended. It’s better to run a separate HTTP server on a different port for the /metrics endpoint. This allows you to restrict access to internal applications only, keeping the metrics private rather than publicly accessible.
package main

import (
    // ...
    "github.com/prometheus/client_golang/prometheus"
	"github.com/prometheus/client_golang/prometheus/promauto"
	"github.com/prometheus/client_golang/prometheus/promhttp"
)

var (
        gaugeNewUsersTotal = promauto.NewGauge(prometheus.GaugeOpts{
                Name: "o11y_new_users_total",
                Help: "Total number of new users",
        })
)

func main() {
	ctx := context.Background()

    // ...
	r := chi.NewRouter()

    r.Handle("/metrics", promhttp.Handler())


	r.Post("/user", func(w http.ResponseWriter, r *http.Request) {
        // ...
        gaugeNewUsersTotal.Inc()
	})
    // ...
}

// Now if we curl the /metrics endpoint should see metrics in Prometheus format
// $ curl -s localhost:3000/metrics | head
// # HELP go_gc_duration_seconds A summary of the wall-time pause (stop-the-world) duration in garbage collection cycles.
// # TYPE go_gc_duration_seconds summary
// go_gc_duration_seconds{quantile="0"} 0
// go_gc_duration_seconds{quantile="0.25"} 0
// go_gc_duration_seconds{quantile="0.5"} 0
// go_gc_duration_seconds{quantile="0.75"} 0
// go_gc_duration_seconds{quantile="1"} 0
// go_gc_duration_seconds_sum 0
// go_gc_duration_seconds_count 0
// # HELP go_gc_gogc_percent Heap size target percentage configured by the user, otherwise 100. This value is set by the GOGC environment variable, and the runtime/debug.SetGCPercent function. Sourced from /gc/gogc:percent.

// We should also be able to see our custom metric "o11y_new_users_total"
// Every time when we create a user successfully the value of our metric should
// increment with 1
// $ curl -s localhost:3000/metrics | grep o11y_new_users_total
// # HELP o11y_new_users_total Total number of new users
// # TYPE o11y_new_users_total gauge
// o11y_new_users_total 3
OpenTelemetry Instrumentation
Structuring logs and exposing metrics are things almost every production system does. Instrumentation, however, is often missing—and that’s a serious mistake, especially in a microservices architecture. Instrumentation allows us to track the complete lifecycle of a single request. From a single point of view, we can see which services are involved, where the request spends the most time, which queries are slow, and much more. This level of visibility is extremely powerful. The main challenge is that, unlike logging and metrics, instrumentation cannot be added without modifying the application’s source code. With logs and metrics, if we expose data in a predefined format (as shown above), we can rely on daemons, agents, or sidecar containers to collect and forward that data. In this case, the responsibility does not fall on the developer. For example, there is no need to use the AWS CloudWatch SDK directly in the application to send logs to AWS. We can simply output logs in JSON format, let Fluent Bit collect them, and forward them to CloudWatch. This approach prevents us from reinventing the wheel every time. Unfortunately, the same flexibility does not exist for instrumentation—code changes are required. An additional problem arises when every team instruments their applications in a custom way. If we later decide to change the tracing backend or provider, we may be forced to modify instrumentation code across all services, which is both time-consuming and error-prone. This is exactly why OpenTelemetry emerged. It is a community-driven standard for instrumentation, supported by many major tracing backends. Jaeger, starting from version 2, is no exception. In this blog post, we will use Jaeger as the tracing backend, but once your applications are instrumented with OpenTelemetry, switching to another backend becomes straightforward.
For this example, we will not rely solely on the OpenTelemetry SDK. Since our HTTP service is built with Chi, we can take advantage of the existing otelchi middleware, which provides automatic instrumentation for incoming HTTP requests and propagates trace context across handlers. In addition, our service uses PostgreSQL, which is accessed through Go’s standard database/sql package. To capture database-level telemetry—such as query execution time, errors, and span relationships—we wrap the SQL driver using otelsql. The code snippet below demonstrates how to initialize the OpenTelemetry tracer provider, instrument HTTP routes with otelchi, instrument database queries with otelsql, and ensure proper context propagation so that all spans belong to a single trace.
package main
import (
// ...
"go.opentelemetry.io/otel"
"go.opentelemetry.io/otel/attribute"
"go.opentelemetry.io/otel/codes"
"go.opentelemetry.io/otel/exporters/otlp/otlptrace"
"go.opentelemetry.io/otel/exporters/otlp/otlptrace/otlptracehttp"
"go.opentelemetry.io/otel/propagation"
"go.opentelemetry.io/otel/sdk/resource"
sdktrace "go.opentelemetry.io/otel/sdk/trace"
semconv "go.opentelemetry.io/otel/semconv/v1.4.0"
"go.opentelemetry.io/otel/trace"
)
func initTracer(ctx context.Context, serviceName string) (*sdktrace.TracerProvider, error) {
exporter, err := otlptrace.New(
ctx,
otlptracehttp.NewClient(
otlptracehttp.WithInsecure(),
),
)
if err != nil {
return nil, fmt.Errorf("init exporter: %w", err)
}
tp := sdktrace.NewTracerProvider(
sdktrace.WithSampler(sdktrace.AlwaysSample()),
sdktrace.WithBatcher(exporter),
sdktrace.WithResource(resource.NewWithAttributes(
semconv.SchemaURL,
semconv.ServiceNameKey.String(serviceName),
)),
)
otel.SetTracerProvider(tp)
otel.SetTextMapPropagator(
propagation.NewCompositeTextMapPropagator(
propagation.TraceContext{},
propagation.Baggage{},
),
)
return tp, nil
}
// have to export default OTel envs in order to work
// export OTEL_EXPORTER_OTLP_ENDPOINT=http://localhost:4318
// export OTEL_EXPORTER_OTLP_INSECURE=true
func main() {
ctx := context.Background()
serviceName := "our-o11y-service"
// Tracing
tp, err := initTracer(ctx, serviceName)
if err != nil {
log.Fatal().Err(err).Msg("failed to init tracer")
}
defer func() {
_ = tp.Shutdown(ctx)
}()
tracer := otel.Tracer(serviceName)
// use otelsql instead of database/sql
db, err := otelsql.Open(
"postgres",
"postgres://user:pass@localhost:5432/o11y?sslmode=disable",
)
// ...
r := chi.NewRouter()
r.Use(otelchi.Middleware(serviceName, otelchi.WithChiRoutes(r)))
r.Post("/user", func(w http.ResponseWriter, r *http.Request) {
// ...
ctx, span := tracer.Start(
r.Context(),
"CreateUser",
trace.WithAttributes(
attribute.String("user.name", user.Name),
attribute.Int("user.age", user.Age),
),
)
defer span.End()
result, err := queries.CreateUser(ctx, database.CreateUserParams{
ID: int64(snowflake.ID()),
Name: user.Name,
Age: int64(user.Age),
})
if err != nil {
span.RecordError(err)
span.SetStatus(codes.Error, err.Error())
http.Error(w, err.Error(), http.StatusInternalServerError)
return
}
// ...
if err := json.NewEncoder(w).Encode(result); err != nil {
span.RecordError(err)
span.SetStatus(codes.Error, err.Error())
log.Err(err).Msg("failed to encode response")
return
}
})
// ...
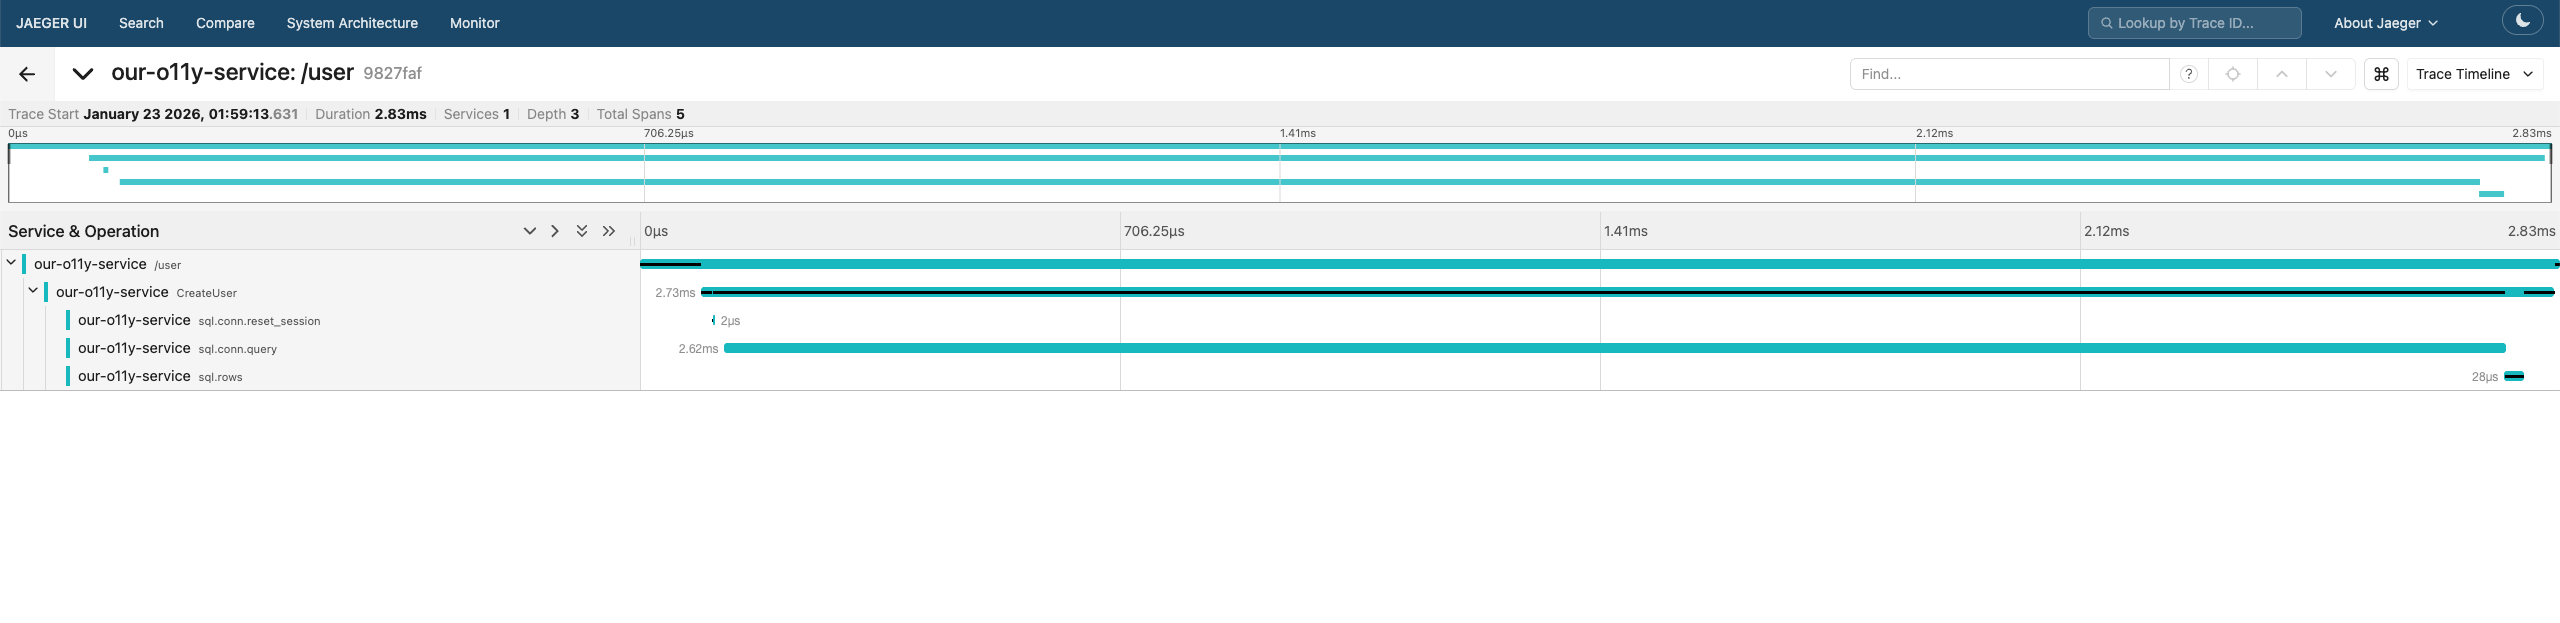
}After opening the Jaeger UI, you should see a newly registered service. Selecting this service will reveal the traces generated by our application.
Conclusion
Building a self-managed observability stack gives you deep insight into how metrics, logs, and traces flow through your system. By combining Prometheus, Grafana, Fluent Bit, Elasticsearch, and OpenTelemetry, even a small Go service can become fully observable and production-ready. Observability isn’t an afterthought—it’s a design choice that pays off when debugging, scaling, or evolving your applications. You can see the full configuration of the observability stack here, and the setup of the Go service here.